Real Monte Carlo, real scale
Up to 10,000 paths per simulation, modeled with geometric Brownian motion and asset correlation. The same engine that powers institutional risk desks — calibrated for individual investors.
Monte runs up to 10,000 Monte Carlo simulations on your real portfolio — actual tickers, real prices, your contributions and withdrawals — and tells you the probability you'll hit your goal. No spreadsheets. No black boxes. Every number is explained.
Most retirement calculators give you one number from one assumption. Monte stress-tests your plan against thousands of futures — and shows its work.
Up to 10,000 paths per simulation, modeled with geometric Brownian motion and asset correlation. The same engine that powers institutional risk desks — calibrated for individual investors.
Add real symbols — AAPL, VOO, QQQ, your 401(k) funds — and Monte pulls 10 years of adjusted-close price history. That means dividends and splits are baked in, so your "return" is the actual return you would have earned.
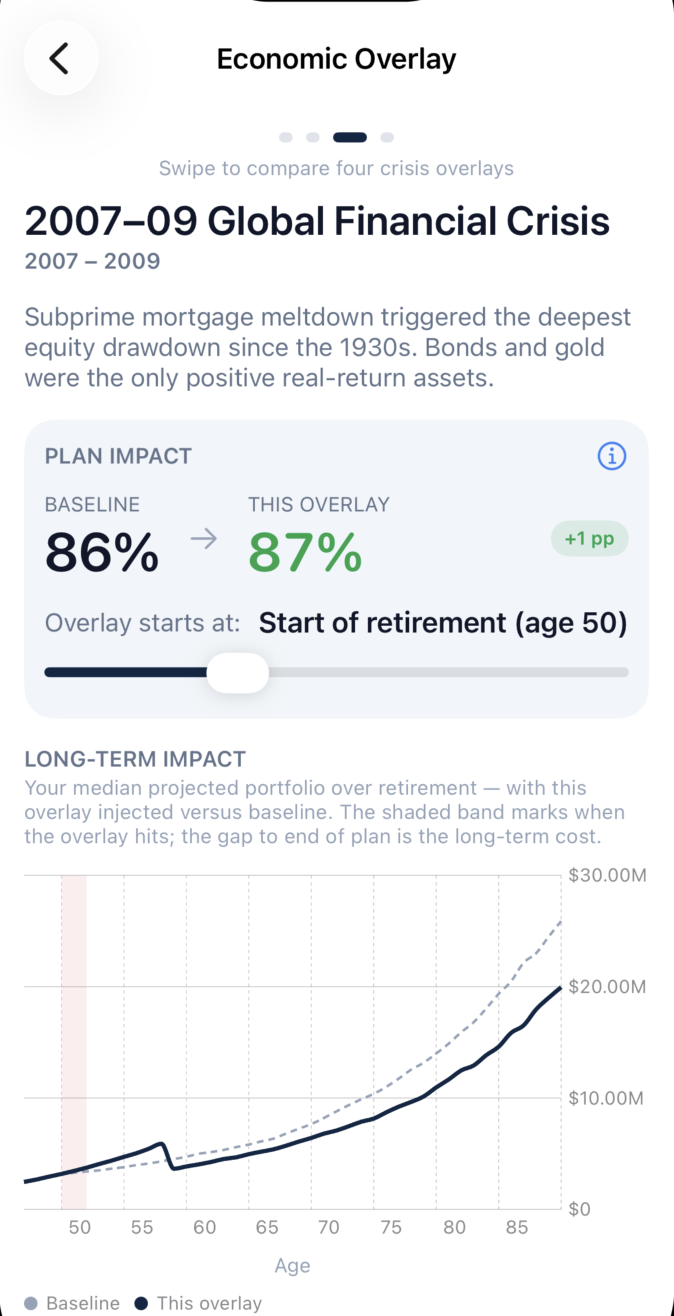
Overlay your plan with the 2008 financial crisis, 1970s stagflation, the dot-com bust, or COVID. See exactly how much your probability of success moves when the world doesn't cooperate.
For every result, Monte shows you the inputs: historical return, the forecast assumption it actually used, volatility per asset, and the full distribution of outcomes — not just a single average.
Model the full life cycle — monthly contributions during accumulation, inflation-adjusted spending in retirement, Social Security, and Smart Spend dynamic withdrawal logic.
Your portfolio lives on your device — not a server we own. No account to create, no brokerage logins, no data sold or shared. Only the ticker symbol leaves your phone, and only to look up its price.
Every screen below is the real app, running a real plan. No mockups, no marketing renders.
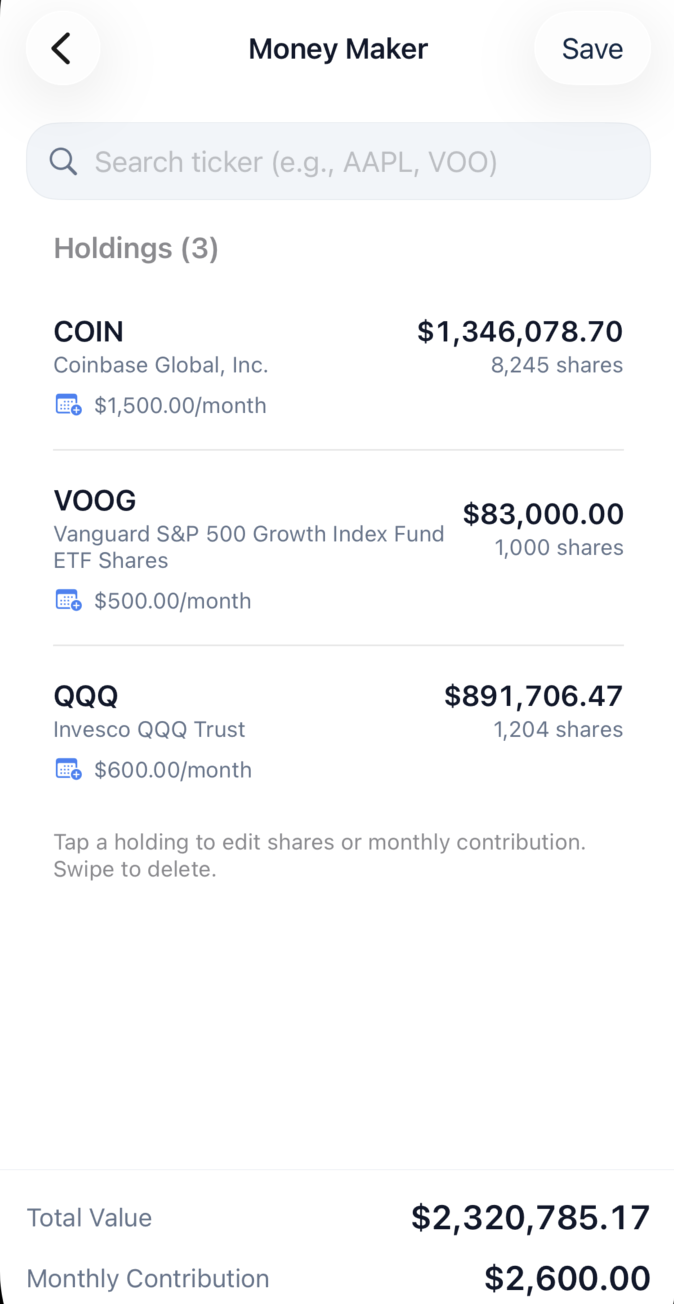
Search 6,150+ U.S. stocks, ETFs, bonds, and mutual funds. Add real share counts and monthly contributions, and Monte tracks total balance and dollar-weighted exposure as you go. No account linking, no read-only OAuth, no surprise data sharing.
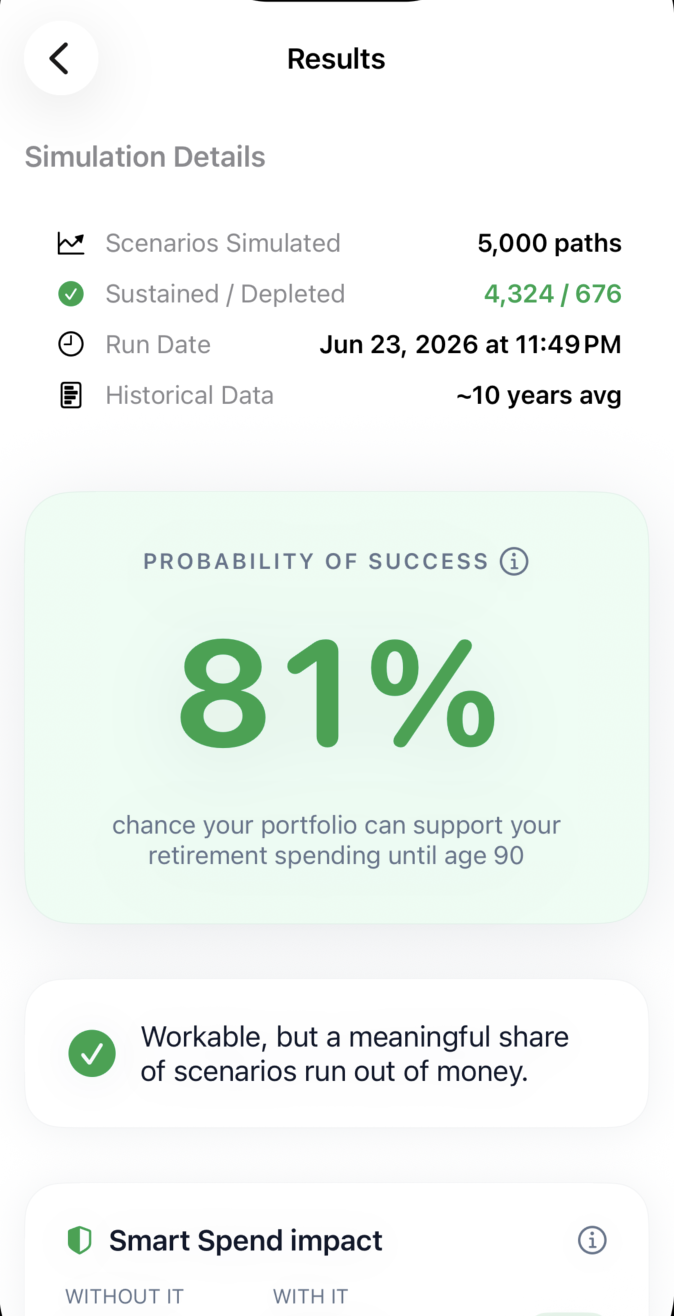
Monte simulates up to 10,000 month-by-month paths through retirement — accumulation, drawdown, inflation, Social Security, the works. You get one number that actually means something: the share of futures where your money outlasts your spending.
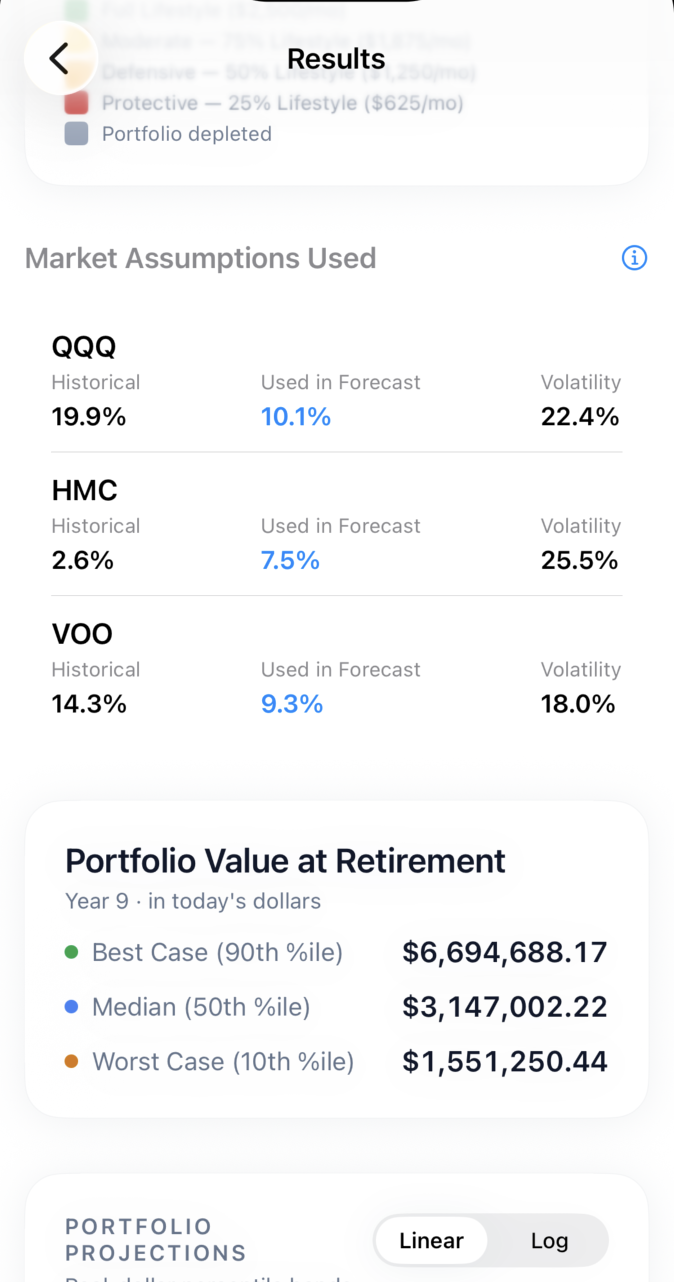
Other apps hide their inputs. Monte shows you, per ticker, the historical return, the forecast Monte actually used, and the volatility — so you can sanity-check the model before you trust the answer. Then it gives you the best, median, and worst case at retirement, in today's dollars.
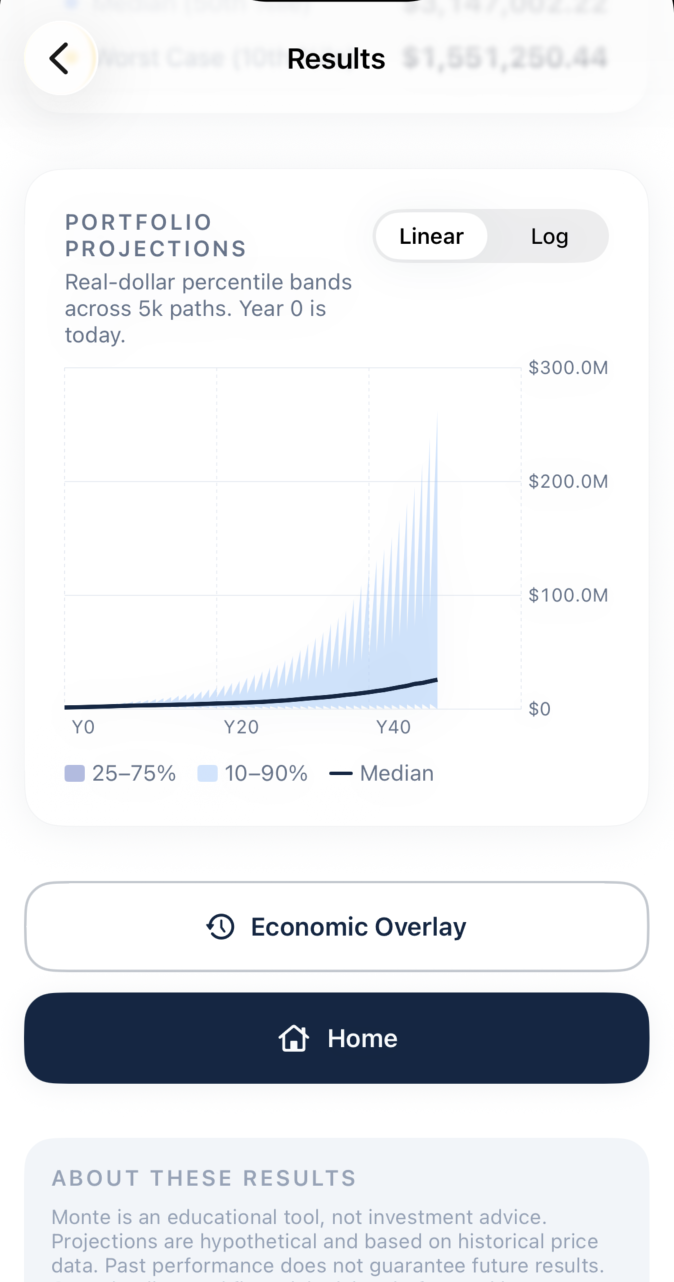
Most calculators give you a single line. Monte gives you the fan: the 25–75% band, the 10–90% band, and the median path — all the way through retirement. Toggle between linear and log scale to see what's really driving long-term outcomes.
Inject real historical crises into your plan and see what happens. Each overlay is calibrated from actual return data and shows you the impact on your probability of success and the long-term cost to your median balance — all on top of your existing simulation.
One free tier with everything most people need. Pro and Max unlock deeper analysis for serious planners.
Monte is free to download. Run your first simulation in under five minutes.
Download on the App Store